The Mass Spectrometer
The Mass Spectrometer (operation)
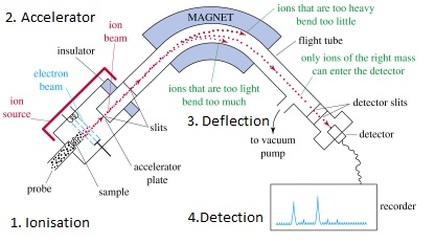
- The mass spectrometer is a scientific instrument that measures the mass-to-charge ratio of ions.
- The process starts with ionization, where the sample is bombarded with high-energy electrons, causing the sample to become ionized.
- The ions are then accelerated and passed through a magnetic field, where they are deflected based on their mass-to-charge ratio.
- The ions are detected by a detector, which produces a signal that is proportional to the number of ions detected.
The Mass Spectrometer (analysis)
- Mass spectrometry can be used to identify the chemical composition of a sample, as well as determine the relative abundance of different components.
- The mass spectrometer can also be used to determine the molecular weight of a sample, which can be useful in determining the chemical structure of the sample.
- Mass spectrometry can be used in a variety of fields, including chemistry, biology, and environmental science.
The Electromagnetic Spectrum
- The electromagnetic spectrum is the range of all types of electromagnetic radiation, from radio waves to gamma rays.
- The different types of electromagnetic radiation have different wavelengths and frequencies, which determine their properties and interactions with matter.
- The electromagnetic spectrum is important in mass spectrometry because the ionization process involves the absorption of high-energy electromagnetic radiation.
Line Spectra
- Line spectra are the unique patterns of spectral lines produced when atoms or molecules emit or absorb electromagnetic radiation.
- Line spectra can be used to identify the chemical composition of a sample, as well as determine the energy levels and electronic configuration of the atoms or molecules.
- Mass spectrometry can be used to produce line spectra, which can provide valuable information about the chemical composition of a sample.
Reading the Graph

Y-axis of the graph.
The X-axis typically represents the mass-to-charge ratio (m/z) of the ions detected by the instrument. The Y-axis represents the relative abundance of each ion.
The peak in the graph corresponds to the ion with the highest relative abundance. Each peak to the left and right of the highest peak corresponds to a different ion, with a slightly higher or lower mass-to-charge ratio.
The height of each peak corresponds to the relative abundance of each ion. The higher the peak, the more abundant the ion. The distance between the peaks corresponds to the mass difference between the ions.
Reading and interpreting these graphs is essential for identifying the chemical composition of a sample and can provide valuable insights into the structure and behavior of molecules.
Written with StackEdit.